Monitoring energy use with Google Sheets, Forms and Apps Script
2014-01-08I recently set up a nifty little Google Apps Script app using Sheets and Forms to track our electricity and gas consumption, and our solar generation. As Steve Howard - chief sustainability officer at IKEA - said in his TED talk Let’s go all-in on selling sustainability,
“If you’re not measuring things, you don’t care, and you don’t know.”
I want to know exactly how much energy we are using so that I can make efficiency adjustments over time, and know exactly how each one performs. How are you supposed to know why your bills are so high, or how to reduce them if you need to, when you don’t know what you’re actually using?
My requirements for the monitoring tool were:
- Something quick and easy to set up that allowed me to quickly enter meter readings
- A calculation of daily consumption/production based on the day’s readings
- If a reading was missed (i.e. we go away on holiday), daily consumption calculation to be averaged out over how many days readings were missed, not spiked on the one day the reading is done
- Calculation of the financial expense and income generated.
- Pretty charts to visualise the data Google Spreadsheets/Forms covered most of my requirements, and Apps Script gives me the flexibility and power to customise where Spreadsheets falls short.
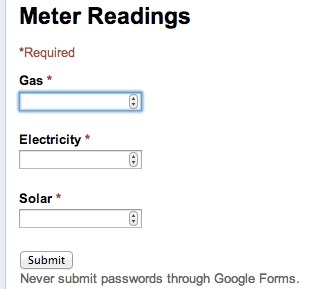
Meter Readings Form - Contains input fields for gas, electricity and solar meter readings. Google Forms now has simple validation to restrict field entries to positive numbers, maximum lengths etc. Nobody else is going to be using my form, but the validation means that when I enter the details on my phone, only the number key pad pops up. Each posted form appends a row to the sheet the form is associated with.

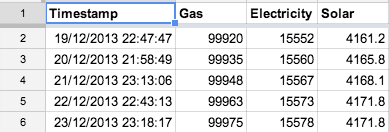
Meter Readings Sheet - This is the sheet that the Form appends to. Each appended row gives me the meter readings for the days I submit the form; but I wanted to know the daily consumption and production, and to not have huge spikes when I forget to, or can’t, enter the meter readings. For this, I needed Apps Script.

Apps Script - I created a trigger to run each day between 2am and 3am. The trigger calls an Apps Script function that reads the last row from the meter readings sheet. If the timestamp for the row is within one day, it means I’ve entered the readings for that evening. It then reads the penultimate row, calculates the days between the two entries and the average consumption/production values, and for each day between, inserts a new row at the top of the Daily sheet.
var timezone = SpreadsheetApp.getActive().getSpreadsheetTimeZone();

var SHEET_METER_READINGS = "Meter Readings";
var SHEET_DAILY_CONSUMPTION = "Daily";

function updateDailyUsage() {
  var meterReadings = SpreadsheetApp.getActive().getSheetByName(SHEET_METER_READINGS);

  var readings = meterReadings.getRange(meterReadings.getLastRow() - 1, 1, 2, meterReadings.getLastColumn()).getValues();

  var penultimateReading = readings[0];
  var lastReading = readings[1];

  if (getDaysBetween(lastReading[0], new Date()) == 0) {
    var daysBetween = getDaysBetween(penultimateReading[0], lastReading[0]);
    var consumption = [];
    for (var i = 1; i < meterReadings.getLastColumn(); ++i) {
      consumption.push(((lastReading[i] - penultimateReading[i]) / daysBetween).toFixed(1));
    }
    var data = [];
    var date = lastReading[0];
    for (var i = 0; i < daysBetween; ++i) {
      data.push([Utilities.formatDate(date, timezone, "dd/MM/yyyy")].concat(consumption));
      date.setDate(date.getDate() - 1);
    }

    var dailyConsumption = SpreadsheetApp.getActive().getSheetByName(SHEET_DAILY_CONSUMPTION);
    dailyConsumption.insertRowsBefore(2, daysBetween);
    dailyConsumption.getRange(2, 1, daysBetween, meterReadings.getLastColumn()).setValues(data);
  }
}

function getDaysBetween(first,second) {
  var oneDay = 24*60*60*1000;
  return Math.round(Math.abs((first.getTime() - second.getTime())/(oneDay)));
}
Daily Sheet - The daily sheet is written to by the Apps Script function, each row being inserted at the top of the sheet, because I don’t want to have to scroll miles to the bottom when the sheet is years old. As well as columns for gas, electricity and solar production/consumption, I have columns for gas and electricity cost, and solar income, which are calculated using the day’s readings (on the same row) and the…

Tariffs Sheet - I’ve input my gas and electricity daily standing charge and tariffs, as well as my solar Feed in Tariff in a single row. The Daily Sheet’s cost and income values are calculated using these. When my tariffs change, I’ll simply insert a row with the new tariffs, and future calculations will be made from those, whilst older ones will remain calculated against the previous ones.

Pretty Graphs Sheet - Well, speaks for itself really:

Your thoughts? I'd love to hear them. Please get in contact.